Author: US Census Bureau Published: 1/6/2024 US Census Bureau
The Census Bureau conducts over 130 surveys and provides data access to thousands of variables through dozens of data tools, a variety of data visualizations, data tables, raw data, and the Census Application Programming Interface (or API for short).
This “Start Here” course is meant to be a quick start guide for beginners, but be sure to explore Census Academy’s many resources when you are ready to learn more.
Learn More
Module 4: Accessing Data
Ready to access statistics? We hand-curated some of the best videos that will help you get started.
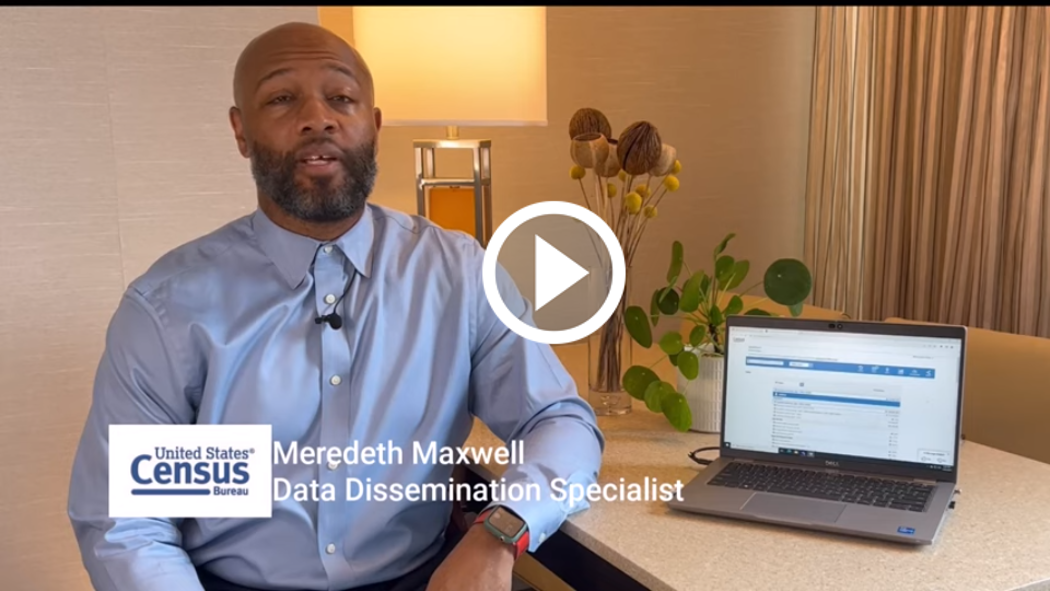
DATA GEM: When to Use QuickFacts, a Tool That Gets You Data Fast! (4:07)
The Census Bureau’s QuickFacts tool is a great place to start your search for popular current statistics. Discover how many people live in your state or county, the local median household income, the number of women-owned businesses, and more. Watch this Data Gem to learn what statistics, geographies, and features you can expect to find in this easy-to-use tool.
DATA GEM: How to Use Filters on data.census.gov (5:49)
Save time when trying to access data products on data.census.gov. Learn how to use pre-selected filters to find new data tables as well as table IDs to access your favorite products.
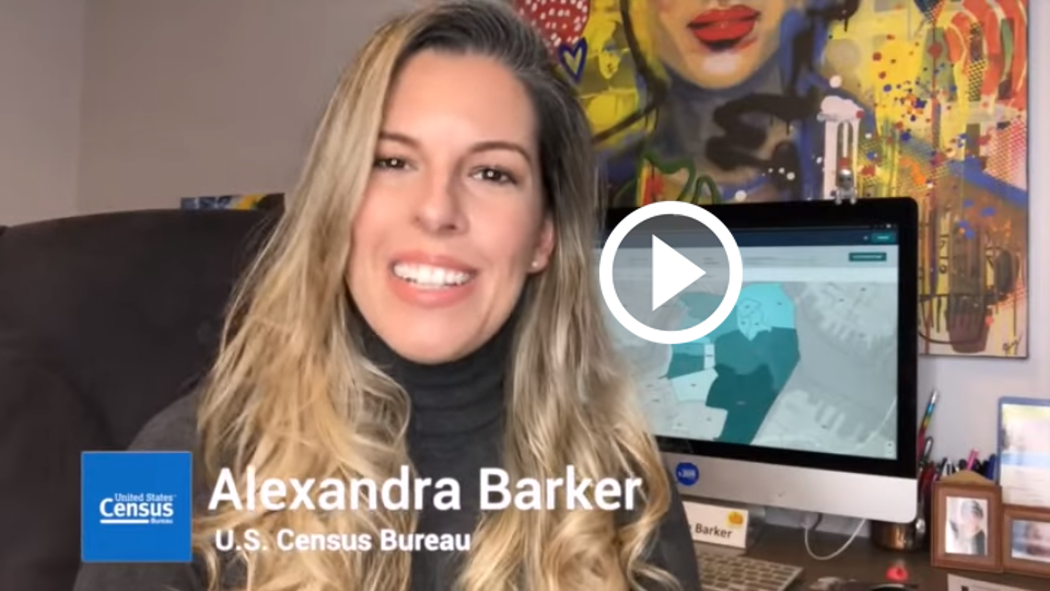
DATA GEM: How to Access Data for Your Neighborhood in Just a Few Clicks (6:47)
Accessing data for your neighborhood or service area can be challenging. But did you know that data.census.gov has a mapping feature that you can use to select your areas? By using census tracts, you can select the boundaries of your area and access demographic, socioeconomic, and housing statistics about your community. Watch this Data Gem for tips.
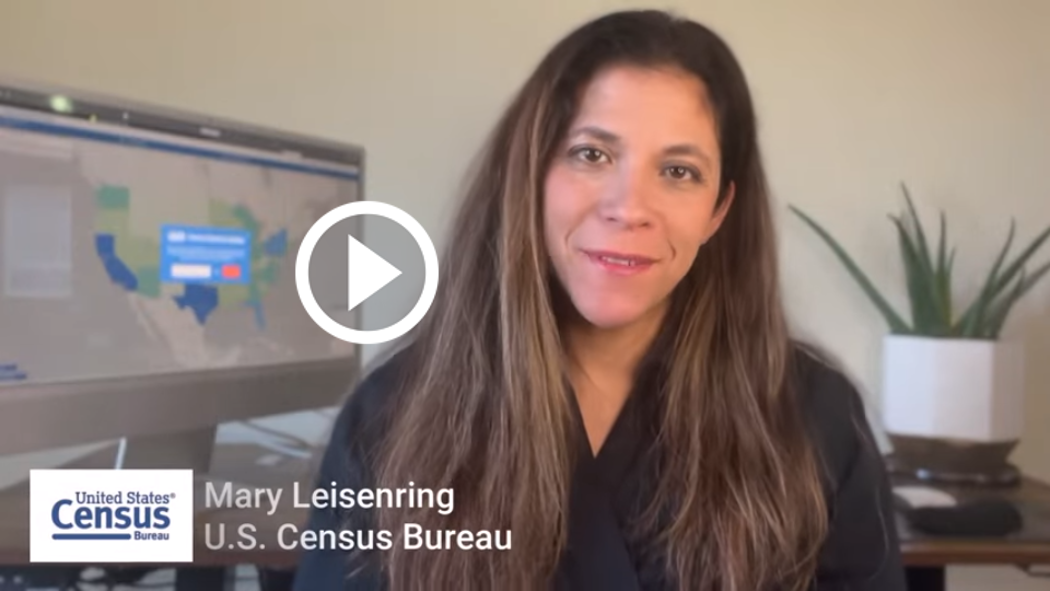
DATA GEM: Locate and Analyze your Customers and Market with Census Business Builder (6:15)
Current and prospective business owners looking to open or expand will want to use our tool, Census Business Builder, to analyze their customers, market, and competition for their industry of interest. In this Data Gem, learn to select and visualize variables for your industry that enable you to:
|