Author: Maksim Markevich Published: 4/19/2022 PV Farm
In this blog, we would like to dive deeper into the main details, challenges and trade-offs that EPC Contractors need to analyse when working on requirements specifications during the tender and pursuit phases for Utility-Scale Solar Farms (PV farms, to be precise).
Assumptions
The AEC industry is a tricky one. Before jumping to any conclusions, we need to build assumptions and stick to them. Otherwise, we stumble and we cannot go far ahead.
-
The primary market is Utility
-
The primary service is EPC
-
The point of view is Contractor
EPC Contractors are responsible for engineering, procurement and construction. They step into a process at a very early stage, after the Developer/Client creates a Request For Proposal (RFP), in other words, requirements specification. Usually, a lot of contractors bid on the same RFP and provide their Quotes. Then, the Developer/Client chooses only one of them and finalises the contract. Two of the most common contract types are lump-sum contracts and time & material contracts. For the sake of simplicity, let’s choose a lump sum contract (a single price for all the works is agreed upon before works begin). After the contract is signed off, EPC Contractor becomes the single point of responsibility for design and construction.
Where to start?
Regarding our previous assumptions, we have an EPC Contractor working on Utility-Scale PV Farms that just signed off a lump sum contract.
There are no more discussions about longest-term energy, lowest operating costs and CAPEX efficiency. The only constraints we have are the contract price and the safety requirements. The contract includes hard cost, soft cost, overheads, and profit margins. The biggest issue here is that when EPC Contractors agree on the price with the Developer/Client, they have a minimal amount of information, so it is pretty crucial to be able to deliver the farm within the targeted spending and profit:
Contract Cost = Hard Cost + Soft Cost + Overheads + Profit Margin
Let’s focus on the hard cost (the most significant part of the spending) and go through all trade-offs EPC Contractors need to evaluate when designing a PV Farm Layout.
Fake PV Farm creation
Let’s find the place where we always wanted to build a solar farm.
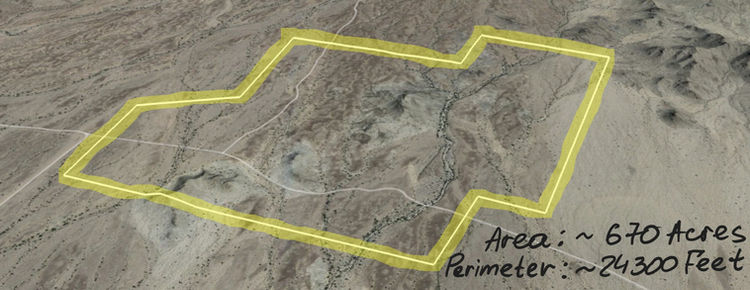

Google maps don’t define solar farm property boundaries in real life. The boundaries come from ALTA land title surveys. But we don’t worry about this for now; for the purpose of this exercise, we will go ahead and create an “imaginary” PV Farm.
Let’s imagine that we are the EPC contractor and we just signed off the contract for the parcel of the land above (surely, we built some assumptions and did some calculations, so it is not an unfounded number) with a lump sum price of $50M. Thus, we have some constraints we cannot exceed with the hard costs and we also have requirements specifications from the Client. These conditions make the definition of the most efficient Utility-Scale PV Farm relatively straightforward: to minimise the hard costs with respect to clients’ requirements and safety.
Before we start having fun with this experiment, let’s define what information we need to have about the site and what Client’s requirements are?
Then, we will break down hard costs into categories and speculate on what trade-offs EPC Contractor typically need to consider?
What information do we need to have about the site?
Obviously, EPC Contractors need this info long before the contract is signed off. But in real life, one will never have enough time to mine the data or analyse it properly. Moreover, the data flow is coming and constantly updating without giving any respite.
We should separate all the data we need about the site into two categories:
-
Data defining immovable boundaries (you cannot cross those boundaries at any cost)
-
Data defining movable boundaries (you can change them at a cost)
In most cases, boundaries are closed polylines or area spots.
Let me provide a few examples of data defining immovable boundaries:
-
ALTA survey (legal document) is a detailed drawing of the property that shows boundaries and their relations to a title.
-
Zoning requirements include required height limitations, setbacks, landscaping, site visibility, enclosure and screening.
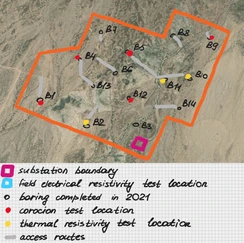
Below you can see some hand-drawn sketches of our fake PV farm site showing what is usually illustrated in the ALTA survey.


For an actual 3000 acres project, the ALTA document is a 10 A1 pages survey that contains lots of notes, legal descriptions, certifications, adjoining ownership tables, keymap, legend and detailed plans with boundaries, roads, fences, flood zones (divided into categories like ‘1% annual chance flood’, ‘0.3% annual chance flood’, etc.), overhead electric lines, power poles, telephone lines, gas lines, fibre optic lines, wash lines and even saguaro cactuses positions ?.
Zoning requirements come from different levels of authority, and they vary regarding country. As we are building an “imaginary” PV farm in Arizona, we need to find the authority responsible for planning permissions – for our site, it is Yuma County AZ. Then, we can discover Yuma County Zoning Ordinance, where we will explore all requirements to meet to get planning/building permission. After that, we submit the application with the proposed site plan and narrative and get them approved (after several attempts ?).


Getting a building permit is the Client’s responsibility, and EPC Contractors do not need to submit the application, but, they need to take into account the approved site plan and narrative. This data defines the immovable boundaries and conditions.
And again, with ‘immovable boundaries’ we mean boundaries we cannot cross at any cost.
Let’s talk about the data defining movable boundaries or any other data we need to understand our hard costs:
-
Topography (elevations representing terrain model) or so-called digital elevation model (DEM)
-
Geology data (geotechnical report and geotechnical evaluation)
-
Hydrology data (elevation analysis, flood maps, flood depth, drainage summary)
-
Georeferenced photos


You might be wondering: why does the data above define movable boundaries? or why those boundaries are movable?
In order to understand this, we need to do a quick sketch about how the site slope can affect cut & fill. The drawing below shows how the single-axis trackers (without undulated capabilities) can manage the site slope. As you can see, we can provide the same amount of modules installed by focusing on different trade-offs. For example, in the first scheme, we decided not to move any dirt, but as a result of it, we got several non-unified and long piers. Therefore, we decided to be more conservative with the pier types and steel tonnage in the second scheme and move lots of dirt instead. But then, if we apply the second scheme to an actual site with a specific topography, we will end up in a situation where we will need to move too much dirt (which becomes expensive). In that case, we might not want to install the trackers in a very sloppy zone; the terrain model conditions created constraints in which we do not wish trackers to be installed. But, those boundaries are movable because when we need to hit a specific energy target and do not have too much space, we can be pushed to use those unfavourable zones.


What are the clients’ requirements?
A short answer – they are always different. Assumptions and schemes are essential in this blog.
Typically, clients’ requirements are a set of documents like Electrical Specification (substation requirements, low voltage requirements, medium voltage requirements, etc.), Electrical Equipment Specification (design life requirements, exterior fire rating requirements, operating temperature range, HVAC system requirements, etc.), Main Power Transformer Specification and many more. Each of those documents contains 20-30 pages of information. But let’s choose the most important ones and aggregate them in 7 bullet points:
-
PV Farm Power = 120 MWdc, which means that PV Farm should be capable of generating 120 MWdc power at high noon on a sunny day
-
Design Life = 30 years, Exterior Fire Rating 2 hours
-
PV Module: First Solar FS-6460-P
-
Inverter SKID: SG3425/3600UD-MV
-
30 ft road width (glass-to-glass)
-
Maximum Voltage Drop: 1.5% for low voltage wiring and 2% for medium voltage wiring
-
Mounting system: Nextracker Horizon, 60/66/72 mods tracker variants, trackers heigh preference = 2 (trackers length maximisation)
For the sake of clarification, some of the requirements above came initially from the Client’s specifications, and some were generated during conversations in the pursuit phase.
Creating a clear list of requirements is a big deal, but, it is equally a big chunk of work to negotiate it and make it all clear. This is something that should be underestimated.
Which trade-offs does an EPC Contractor typically need to go through?
Before talking about trade-offs, let’s do a hard cost breakdown. There are plenty of ways of doing a cost breakdown, and many classification systems exist for this purpose (to name a few of them, MasterFormat, UnitFormat, Uniclass, NRM1/2, SMM7). Some are system-based, others are material-based, but the idea is the same – to group costs in buckets, understand buckets’ proportions and how any change can affect them. As we are talking about EPC contractors, we should focus on the activities or scope of work they provide when building utility-scale PV farms:
-
Equipment (inverters, transformers, DC/AC combiners, disconnects, etc.)
-
Electrical wiring (low voltage wiring, medium voltage wiring, modules, sectionalising cabinets, fibreoptic cables, terminations, DC/AC trenching, etc.)
-
Civil (earthwork grading, roads, fencing, gates, etc.)
-
Mechanical (piles and trackers)
Different people are responsible for the pre-construction phase of the categories above:
-
Solar performance modelling engineers are responsible for the energy model and equipment selection and negotiations with the client, electrical engineers are responsible for all the electrical wiring design.
-
Civil engineers are accountable for cut & fill design, roads, fencing, gates, basins, etc.
-
Structural engineers are accountable for piers.
Besides the people above, there are clients, pre-construction managers, consultancies and sub-contractors. The interactions of the all above end up with a lot of different trade-offs. And when there is enough time, EPC Contractor can consider all the necessary trade-offs, compare different farms options and choose the best configuration of a utility-scale PV farm (utopia ?). But, reality is, there is never enough time. ⌛
It is time to go back to our “imaginary” PV farm site with immovable boundaries:


On the screenshot above, you can see inclusion boundaries and exclusion boundaries. But in real-life, boundaries are not so black and white. For example, exclusion boundaries can carry different functions: do not put trackers, do not put equipment, do not do wiring above, do not do wiring below, do not do roads, do not trench, etc.
Let’s configure our equipment and see what we can get out of this site:


As you see, on the second screenshot above, we got 132,168.64 kW of DC power (which includes 39 inverters, 4053 trackers, 47877 strings and 287322 modules) for our “imaginary” PV farm site with immovable boundaries.
We are pretending to be an EPC Contractor, and we just confirmed that we could hit our energy target for this particular site. And now, we can cut off excess power in the most costly areas.
Hold on a sec!
Before we go further, let’s bring up some framework philosophy here.
We genuinely believe that the right feedback loop for EPC Contractors should be:
-
Test if you can hit the energy target within the maximum available space (site boundaries minus immovable boundaries).
-
Bite off the most costly areas out of site (create some movable boundaries) and see if you can still hit the energy target.
-
Presumably, you will get different scenarios with combinations of movable boundaries that will provide the required energy target. Every scenario will take into account specific trade-offs. So play around with those scenarios and trade-offs until you will get the cheapest option.
If #1 doesn’t work, you shouldn’t have bid on this project. ??️
There are a lot of scenarios (‘what-ifs’) with hard choices to make when it comes to trade-offs. Having the right tools that can help you evaluate one scenario vs. another with appropriate hard cost implications is the key to succeed in the industry.
Back to our “imaginary” PV farm and trade-offs around it
In order to make this blog more detailed, we can operate with four enlarged categories of costs (equipment, electrical, mechanical, civil) for each scenario that we will consider. All the numbers will be fake, so don’t take them seriously, please. All scenarios will be developed with the client requirements we pointed out above.
Initial option or starting point (excessive, only immovable boundaries)
PV Farm Power = 132.2 MWdc (12.2 MWdc more than required)
Inverters SKID number = 39
Trackers number = 4053
Modules number = 287322
Equipment Cost = $5.85M
Mechanical Cost = $10.14M
Electrical Cost = $13.65M
Civil Cost = $9.36M
Total Cost = $39.00M


Option #1: reducing earthworks
The site has several prominent hills. We will try to avoid them. At the same time, while doing that, we should always keep in mind that we cannot go below 120 MWdc.


Here is what we got:
PV Farm Power = 121.9 MWdc (close to our target)
Inverters SKID number = 36
Trackers number = 3759
Modules number = 265062
Equipment Cost = $6.35M
Mechanical Cost = $9.18M
Electrical Cost = $13.42M
Civil Cost = $6.35M
Total Cost = $35.30M


Option #2: reducing the cost of trenching pathways and roads
The layout above has many zigzag roads. That happened because the algorithm tried to save 2-tracker height across the whole site.


We can create another layout with a 3-tracker height within the same buildable area and check what we get:
PV Farm Power = 122.03 MWdc
Inverters SKID number = 34 (here we accidentally improved inverters number)
Trackers number = 3762
Modules number = 265290
Equipment Cost = $6.19M
Mechanical Cost = $9.83M
Electrical Cost = $14.56M
Civil Cost = $5.82M
Total Cost = $36.40M


As we see above, despite some savings from civil and equipment spending, we increased the electrical wiring cost, and hence the total cost.
Option #3: reducing mechanical cost
We used three trackers configurations (60/66/72 mods) in previous scenarios. We can test the layout with only 72 mods trackers, which should reduce the number of external and motor piles and positively affect mechanical cost.


As you can see, with our initial attempt (top left screenshot), we cut off some energy and didn’t hit the energy target. So we decided to use different trackers positioning. In some cases, it can bring more power, especially for sites like ours. Thus we got:
Power = 111.28 – 14.7 – 26.76 + 50.3 = 120.12 MW
Inverters SKID number = 34
Trackers number = 3627
Modules number = 261144
Equipment Cost = $6.61M
Mechanical Cost = $8.56M
Electrical Cost = $15.17M
Civil Cost = $8.56M
Total Cost = $38.90M
Option #4: reducing wiring cost by using another low voltage wiring pattern
With option #3, we reduced the mechanical cost, but we increased electrical and civil expenses, so we should probably decide not to go any further with this option. Let’s use option #2 as a starting point for reducing wiring costs by using another low voltage wiring pattern. There are many different ways how current can go from modules to transformers, see some examples below:


In order to find the most efficient low voltage wiring EPC Contractor should go through many different options and be able of getting quick electrical wiring feedback on any layout changes. Let’s leave this fascinating exercise behind the scenes and see what we got:
PV Farm Power = 122.03 MWdc
Inverters SKID number = 34
Trackers number = 3762
Modules number = 265290
Equipment Cost = $6.07M
Mechanical Cost = $9.68M
Electrical Cost = $11.15M
Civil Cost = $5.90M
Total Cost = $32.80M


Option #5: reducing equipment costs by using inverter skids more efficiently
There are many places we can refine equipment efficiency or electrical wiring efficiency, especially taking into account that we have 2033.4kWdc in reserve.


It is a fun process, and at the end of the day, we can be close to our target with the minimum hard costs for our solar farm:


PV Farm Power = 120.013 MWdc
Inverters SKID number = 33
Trackers number = 3696
Modules number = 260898
Equipment Cost = $5.91M
Mechanical Cost = $9.43M
Electrical Cost = $10.86M
Civil Cost = $5.75M
Total Cost = $31.95M
Thus we found the best option:


A good analysis during the pre-construction phase is key to a productive construction process.
Summary
The idea of this blog was to go through the feedback loop and trade-offs EPC Contractors typically face. Please bear in mind that all our speculations were done in a conceptual way and real projects require a much more accurate and considerable way of analysing those scenarios.
We are open to any idea, comment or feedback, so feel free to write a comment below or to contact us.
Different solar PV farm parties need to consider so many exciting trade-offs. And the most efficient Utility-Scale Solar Farm is something everybody is striving to achieve but none is reaching yet.
Interaction and communication are the core of the AEC industry.